Traffic Agents
Nine signalised junctions, five controllers, and an honest way to tell them apart. One PPO policy shared by every junction, scored against four hand-written controllers on identical arrivals.
The result
Delay per vehicle, lower is better. Scored on 5 seeds of arrivals the policy never trained on. The bar is two standard errors of the difference, and it was fixed before the run: beat actuated at 900 and max-pressure at 1,300.
| Demand | Learned | Best baseline | Delay saved | Bar (2 SE) | Verdict |
|---|---|---|---|---|---|
| 600 veh/h | 64.57 ± 0.66 | actuated 64.43 s | -0.14 s | 1.49 s | inside noise |
| 900 veh/h | 92.61 ± 1.28 | actuated 97.52 s | +4.91 s | 2.94 s | beats it |
| 1,300 veh/h | 107.33 ± 1.14 | max-pressure 111.70 s | +4.37 s | 3.60 s | beats it |
At the lightest demand the result is inside its own noise, and is
reported that way. The junctions are not contested there, so no signal plan can beat a
timer by a margin this measurement can see — a win there would be evidence the error
bars were wrong.
Every controller at every level
| Demand | Controller | Mean delay (s) | ± SE | Throughput (veh/h) |
|---|---|---|---|---|
| 600 veh/h | actuated (best baseline) | 64.43 | 0.35 | 16,729 |
| 600 veh/h | learned | 64.57 | 0.66 | 16,651 |
| 600 veh/h | greedy | 66.21 | 1.03 | 16,490 |
| 600 veh/h | max-pressure | 66.83 | 0.81 | 16,438 |
| 600 veh/h | fixed-time | 82.91 | 0.53 | 16,342 |
| 900 veh/h | learned | 92.61 | 1.28 | 18,686 |
| 900 veh/h | actuated (best baseline) | 97.52 | 0.72 | 18,637 |
| 900 veh/h | max-pressure | 97.52 | 0.47 | 17,958 |
| 900 veh/h | greedy | 98.77 | 0.98 | 17,707 |
| 900 veh/h | fixed-time | 99.93 | 0.84 | 18,460 |
| 1,300 veh/h | learned | 107.33 | 1.14 | 19,404 |
| 1,300 veh/h | max-pressure (best baseline) | 111.70 | 1.39 | 18,268 |
| 1,300 veh/h | greedy | 111.92 | 1.11 | 18,224 |
| 1,300 veh/h | fixed-time | 112.48 | 1.06 | 18,842 |
| 1,300 veh/h | actuated | 113.07 | 1.50 | 19,535 |
Throughput is near-identical across all five, because a grid at this demand is limited by its own capacity. The difference a signal plan makes shows up in waiting time.
Checkpoint ladder
Every saved checkpoint scored on the same arrivals. The best is not the last.
| Steps | Delay |
|---|---|
| 76,800 | 138.0 s |
| 230,400 | 114.7 s |
| 537,600 | 91.6 s |
| 998,400 | 86.2 s (best) |
| 1,536,000 | 91.1 s |
The panel
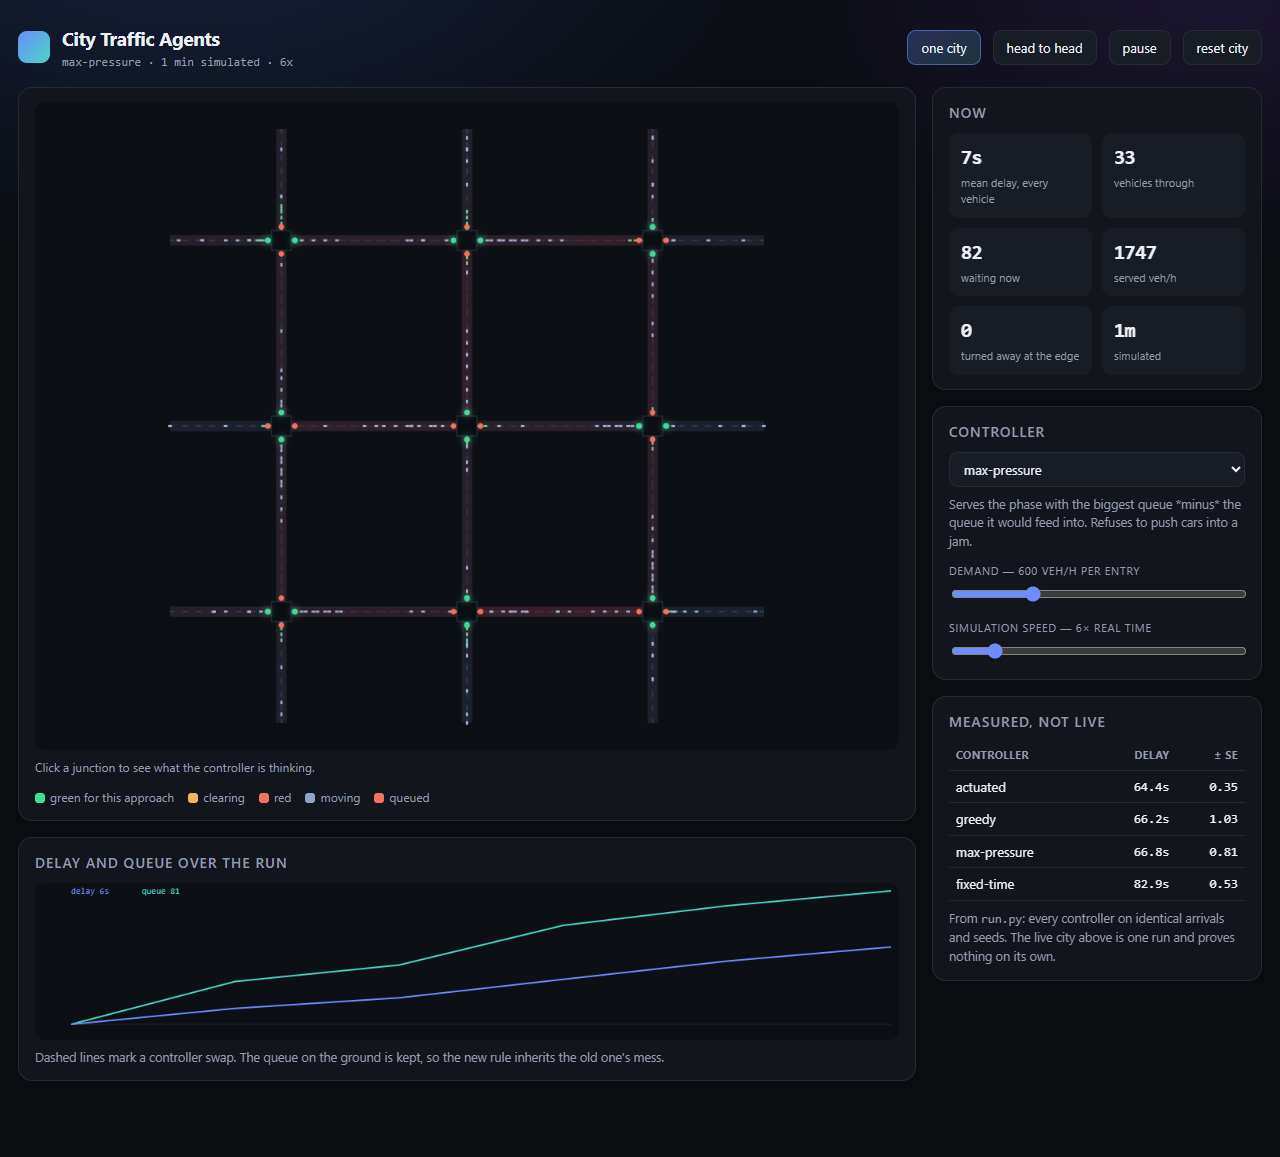
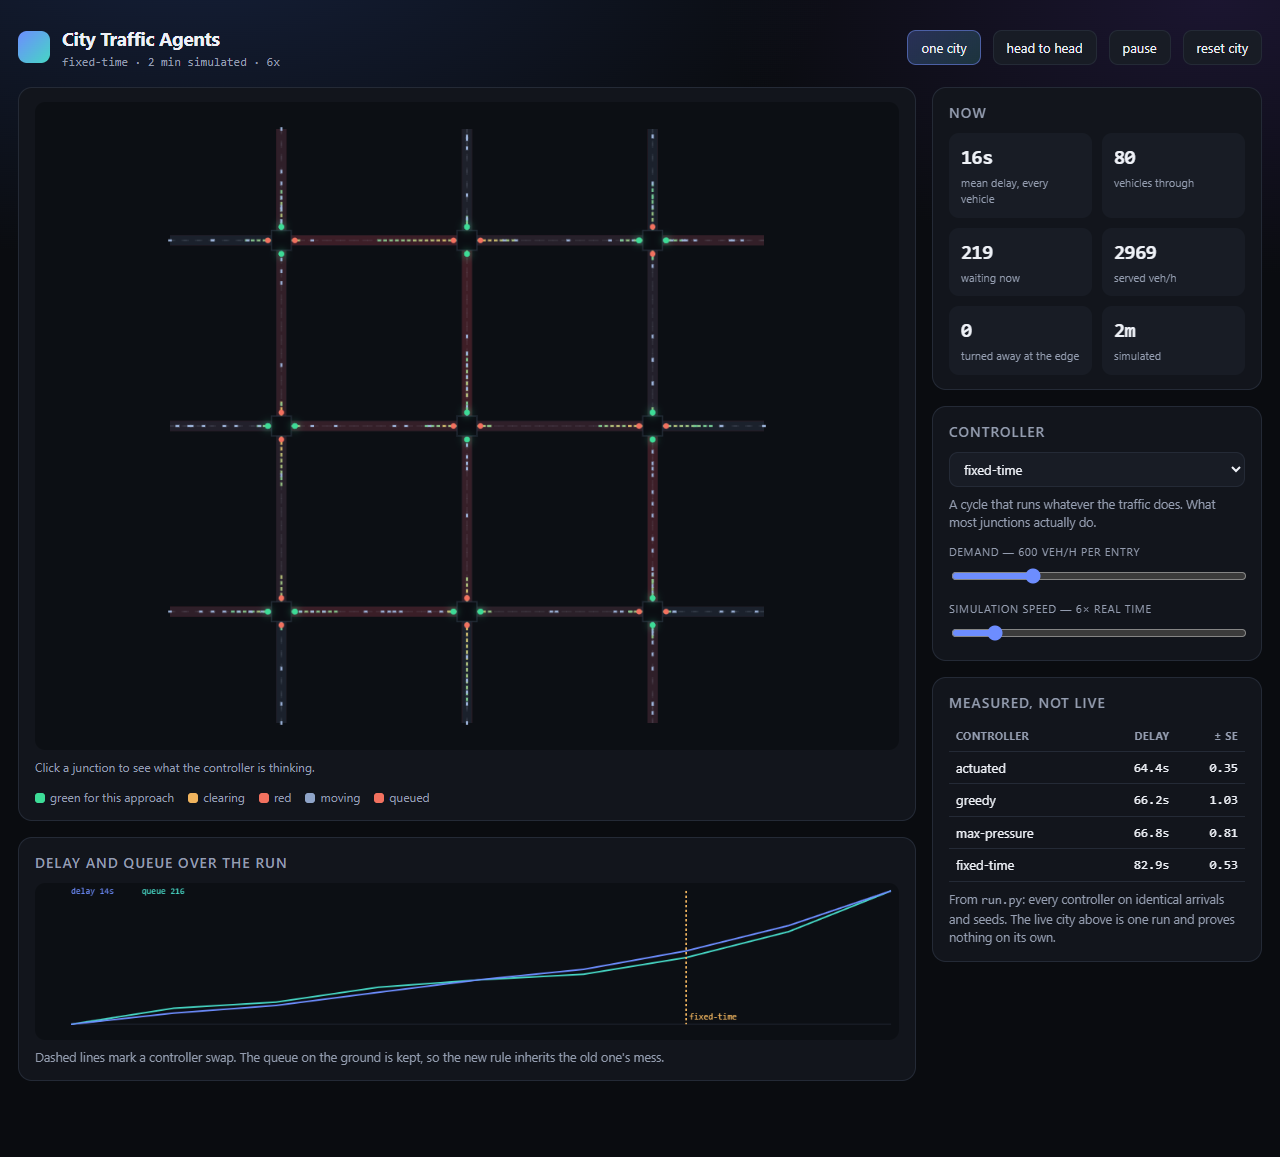
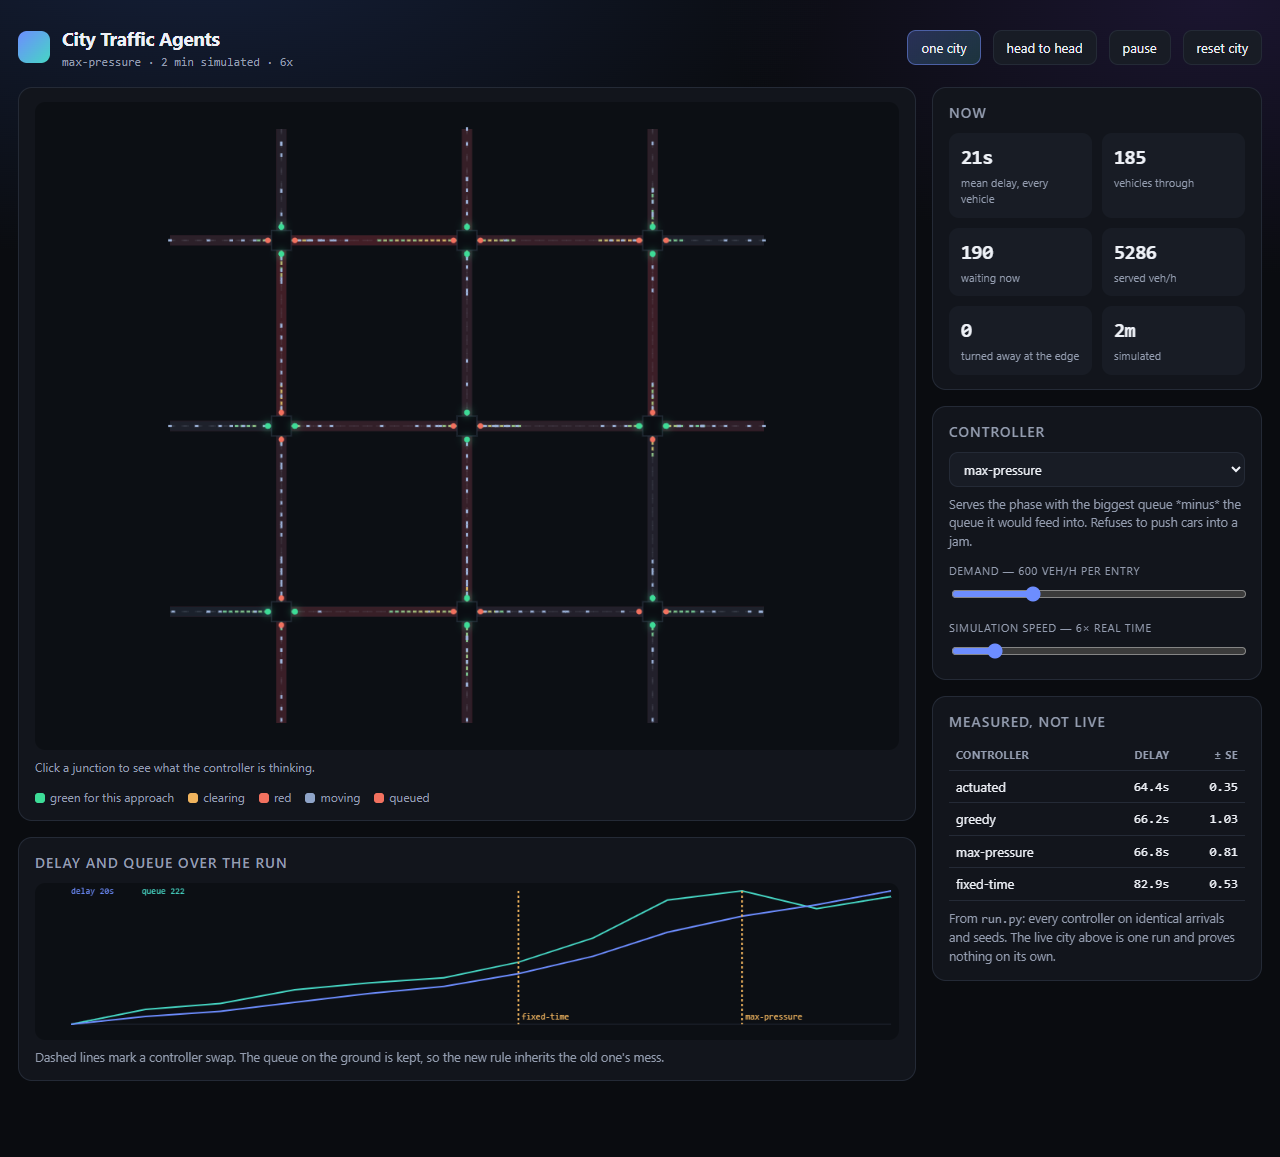
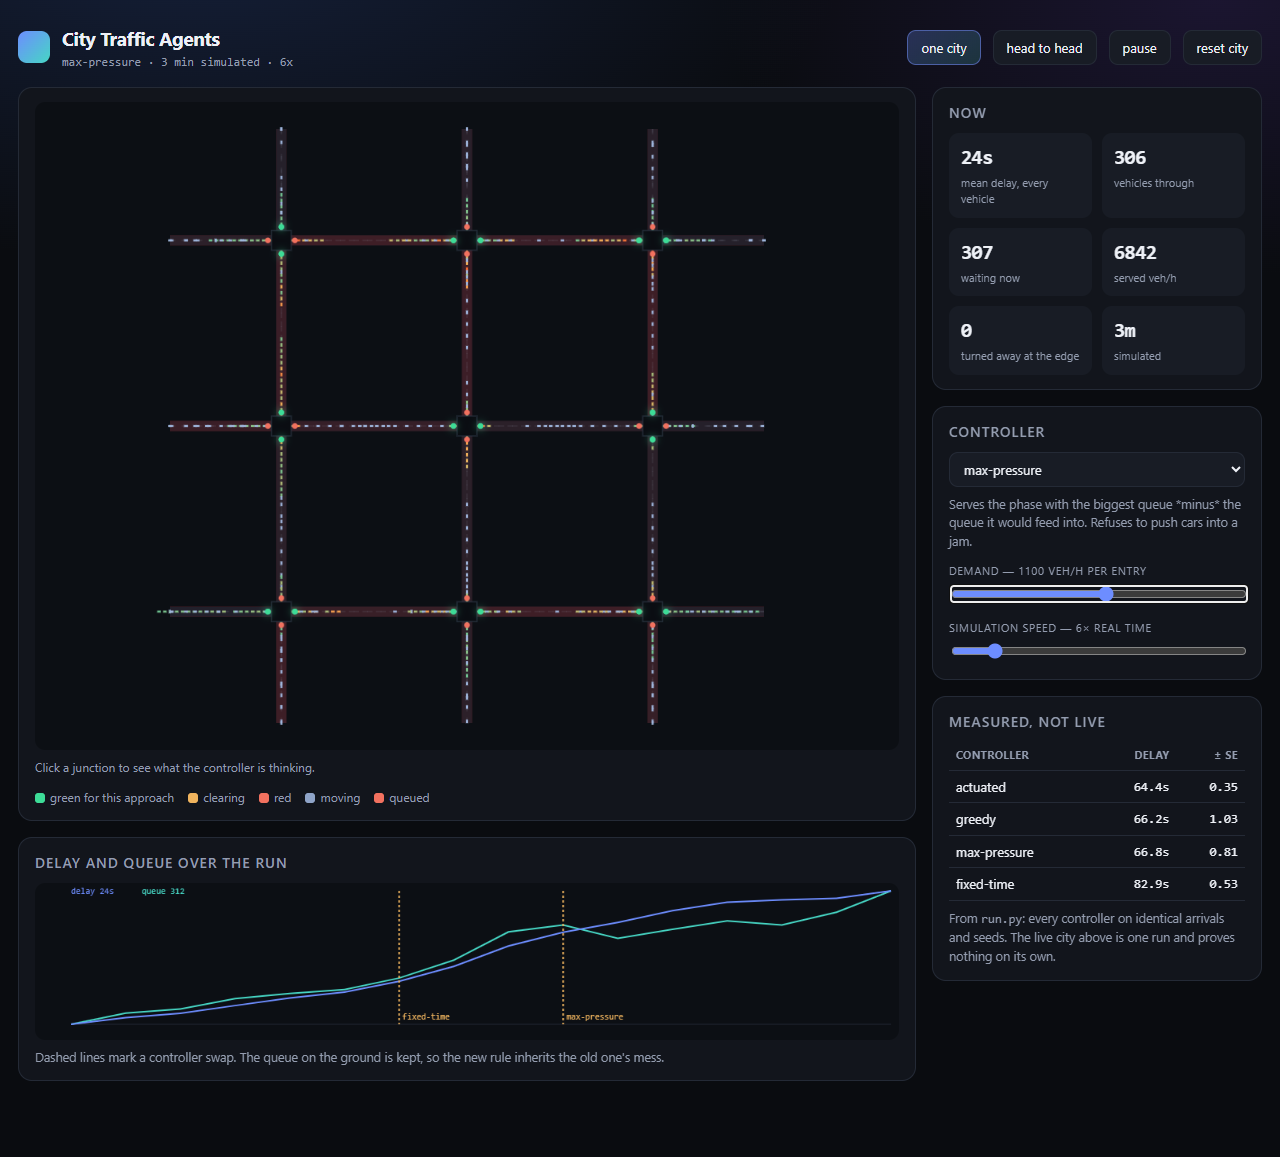
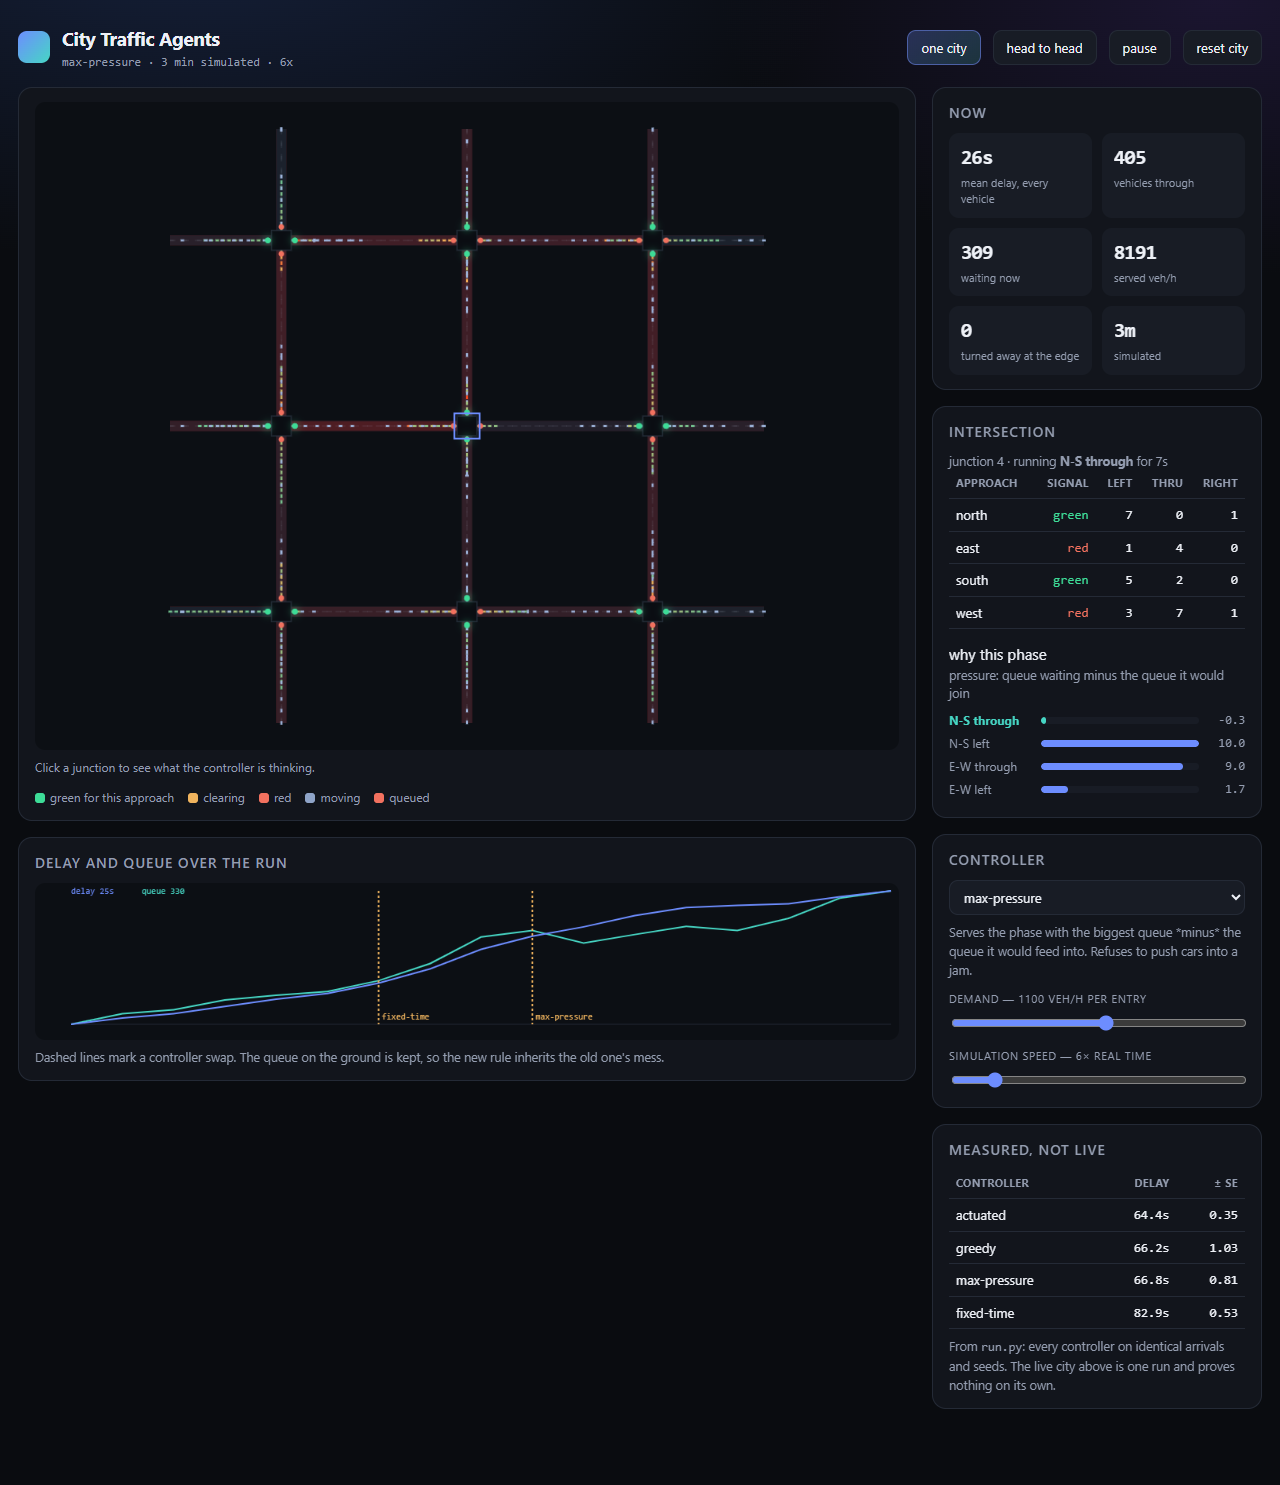
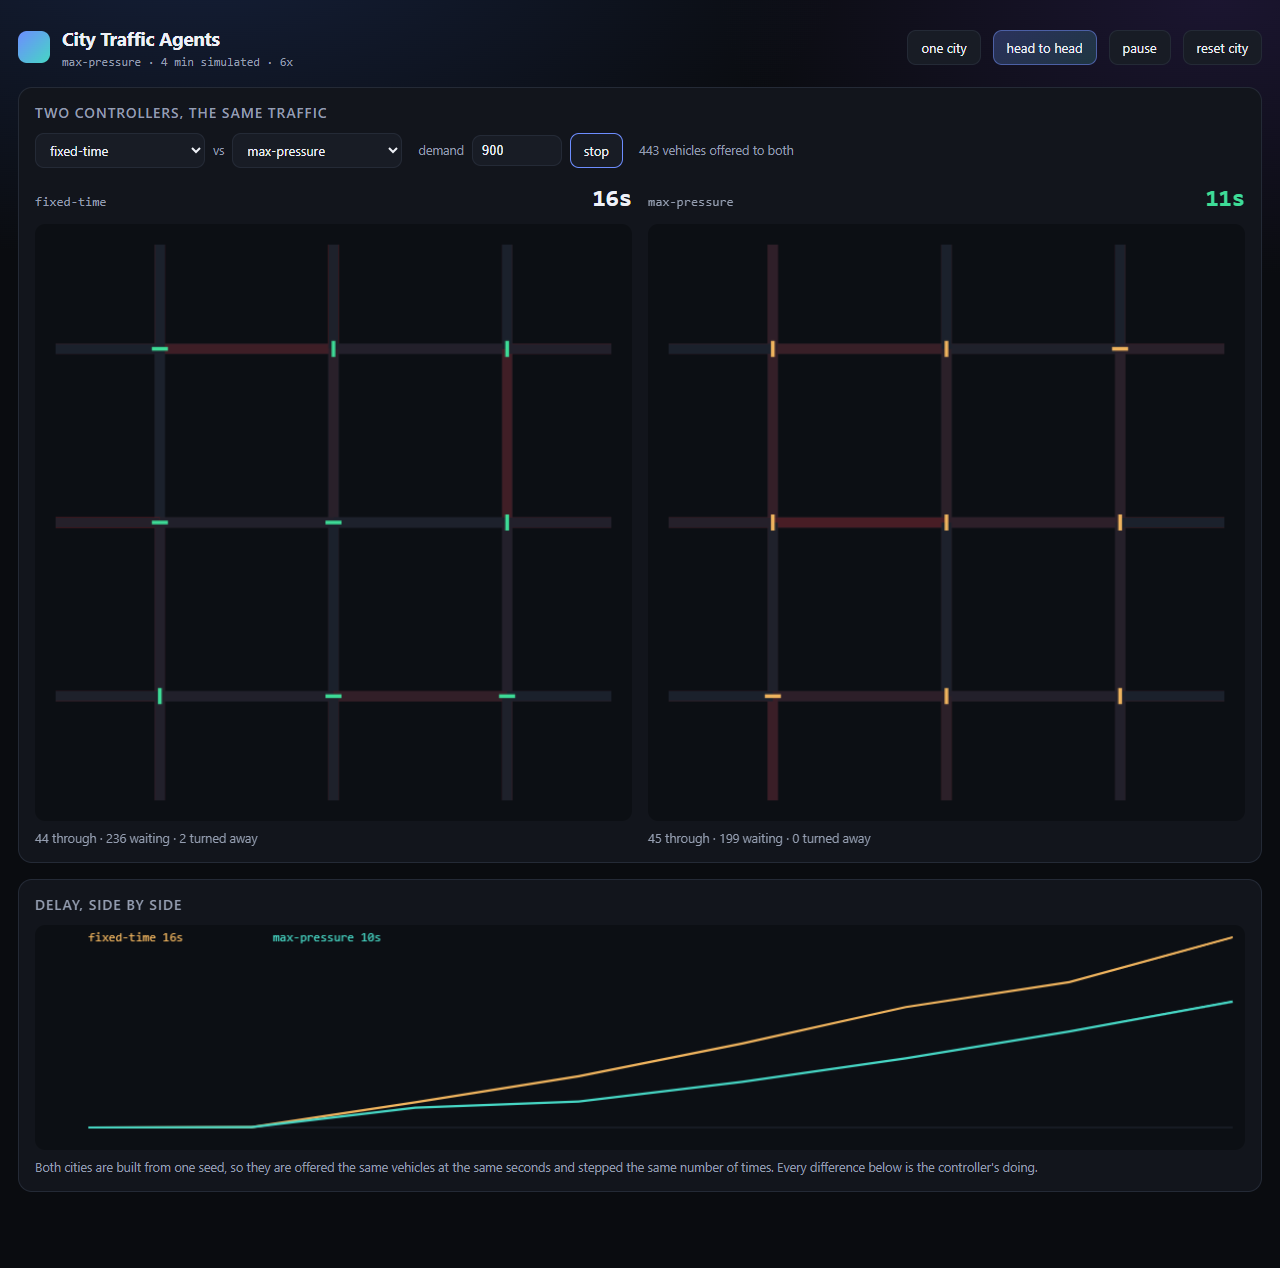
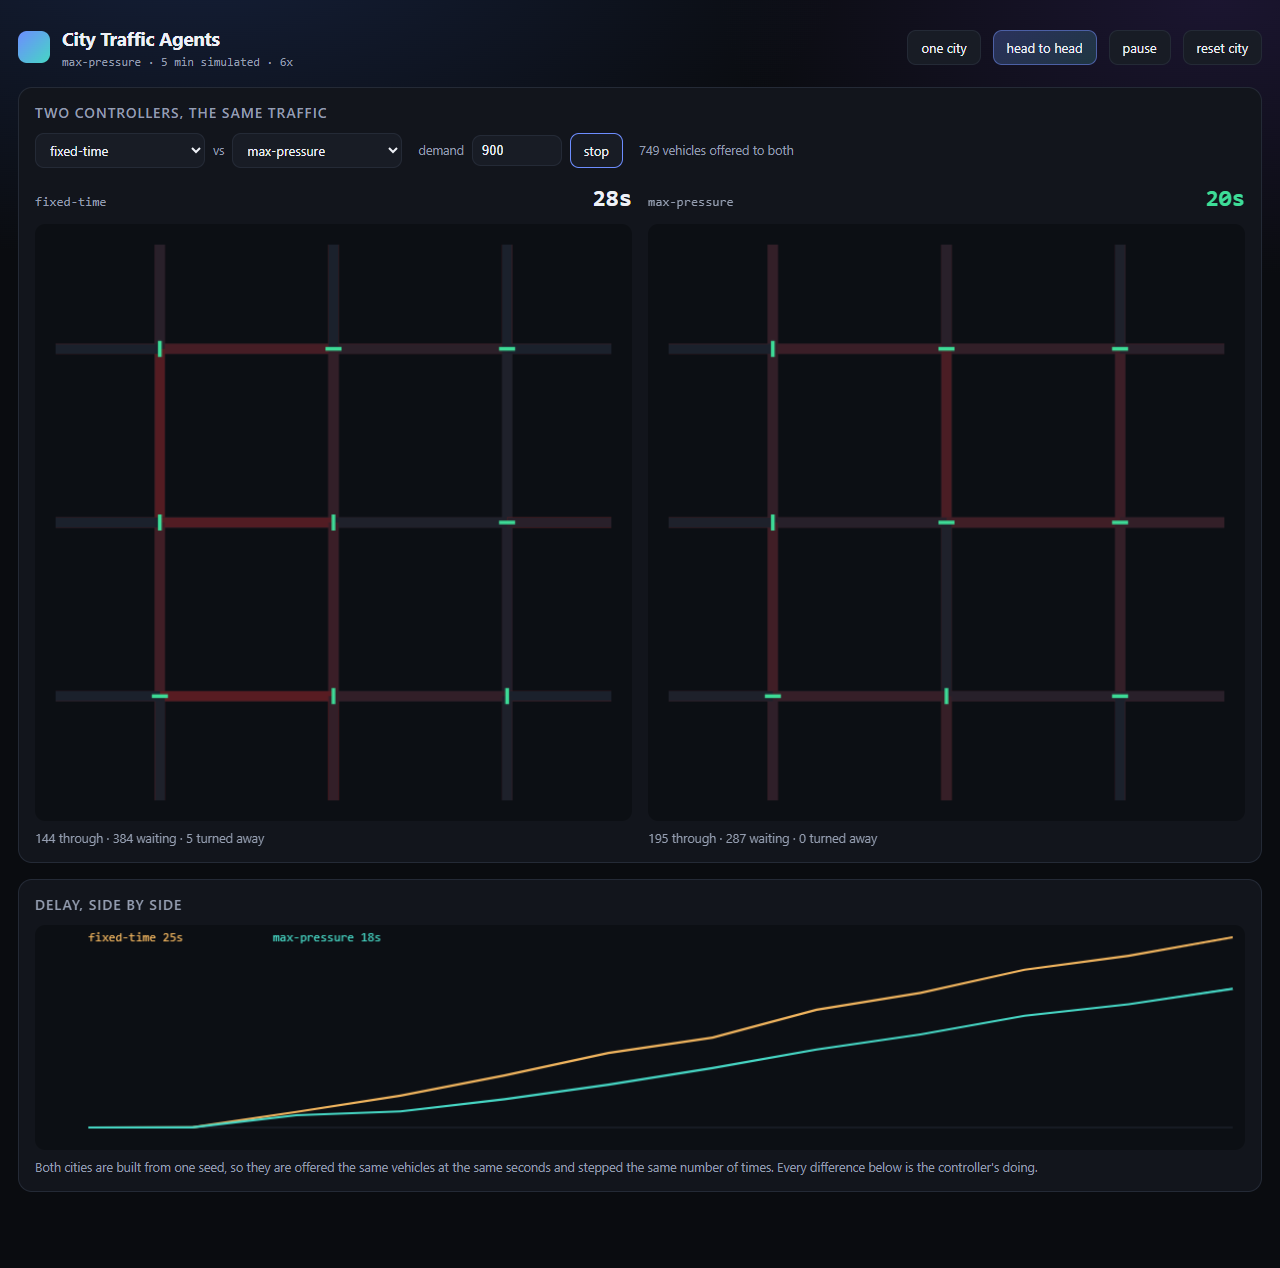
What this is not
- The simulator was written for this project. It is not calibrated against SUMO, CityFlow or a real network, and four of its own defects were found by disbelieving results — vehicles that never left, links with unlimited storage, a tenth of capacity in all-red, and controllers deciding every second.
- One training seed. The five seeds above vary the arrivals at evaluation, not the training run, so this is a result about one policy rather than about the method.
- No learned baseline. The comparison is against four classical controllers, not against published reinforcement-learning controllers.
- Source is private; this page is the result, not the code.